
The Case
Something something come home to roost. Last time, the Mayor was nomayor to be seen (geddit? No-Mayor??) while we were left helping Commissioner Gordon. I mean Captain Impson. And now, the Mayor’s all “help me clear my name”. Questionable “clerical error” with the Mayor’s electricity bill, phishing calls made from the Mayor’s number, and to top it all off, secret documents found at with those hot motots we found last time.
Ok, if we must. But I’m still #TeamProfSmoke.
The Data
We have a list of logs from the city’s (probably very legacy) IT systems, and it’s up to us to trace the hackers.
Let’s check out the IpInfo tabe first.
IpInfo
| take 10
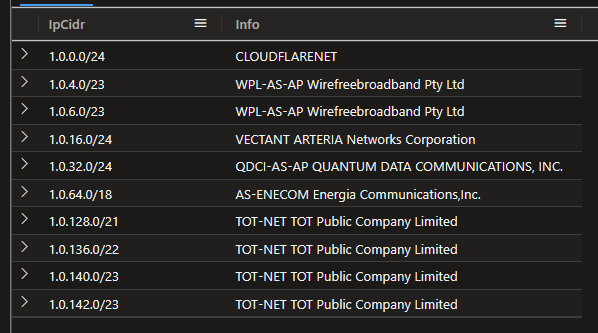
Cool, pretty standard stuff. Let’s see how many unique companies we have.
IpInfo
| summarize Rows=count(), Distinct=dcount(Info)
662028 entries, 71621 distinct companies.
Next let’s look at the logs:
NetworkMetrics
| take 10
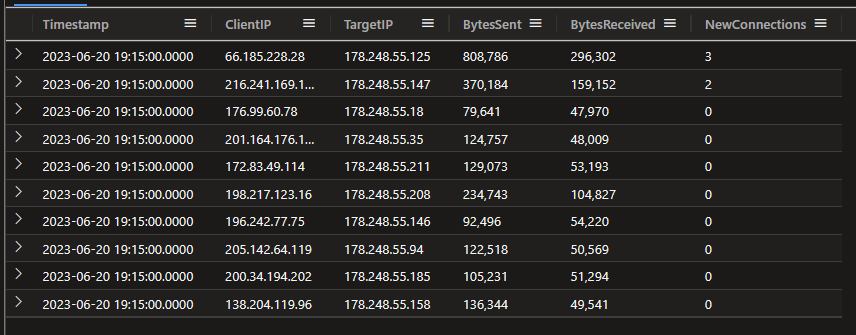
And some quick stats:
NetworkMetrics
| summarize
    DurationDays = datetime_diff('day', max(Timestamp), min(Timestamp)),
    Entries=count(),
    ClientCount=dcount(ClientIP)
29 days worth of data, 44888128 entries, 10191 distinct client IPs.
The Investigation
Let’s start by just tweaking the data slightly. We’re going to be analysing by the IpInfo table and calling something like ipv4_lookup() for every row in the log table is somewhat inefficient. We can save some time later by materialising the results of the lookup into a new table.
.set-or-replace IpInfoEx <|
    NetworkMetrics
    | distinct ClientIP
    | evaluate  ipv4_lookup(IpInfo, ClientIP, IpCidr)

Nice.
Ah, why is the RowCount more than the dcount? Because dcount returns an estimate of the number of distinct values.
Now let’s see if we can find any anomalies in the data. We’ll use series_decompose_anomalies(), a window of 1 day, and look for anomalies in the number of bytes sent. Given we have 71K distinct entries in the IpInfos table, we’ll use mv-expand to expand the results of the anomaly detection and just grab the top 5 results.
let window = 1d;
NetworkMetrics
    | lookup IpInfoEx on ClientIP
    | make-series BytesSent=sum(BytesSent) on Timestamp step window by Info
    | extend  (BytesSentAnomaly, BytesSentAnomalyScore) = series_decompose_anomalies(BytesSent)
    | mv-expand BytesSentAnomalyScore to typeof(double)
    | top 5 by BytesSentAnomalyScore
    | render anomalychart with(anomalycolumns=BytesSentAnomaly, BytesSentAnomalyScore)
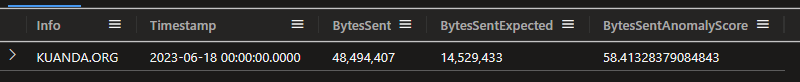
Nice. Well, case solved.
(Copilot just suggested that the Mayor is a major shareholder in Kuanda, who am I to doubt the AI?)
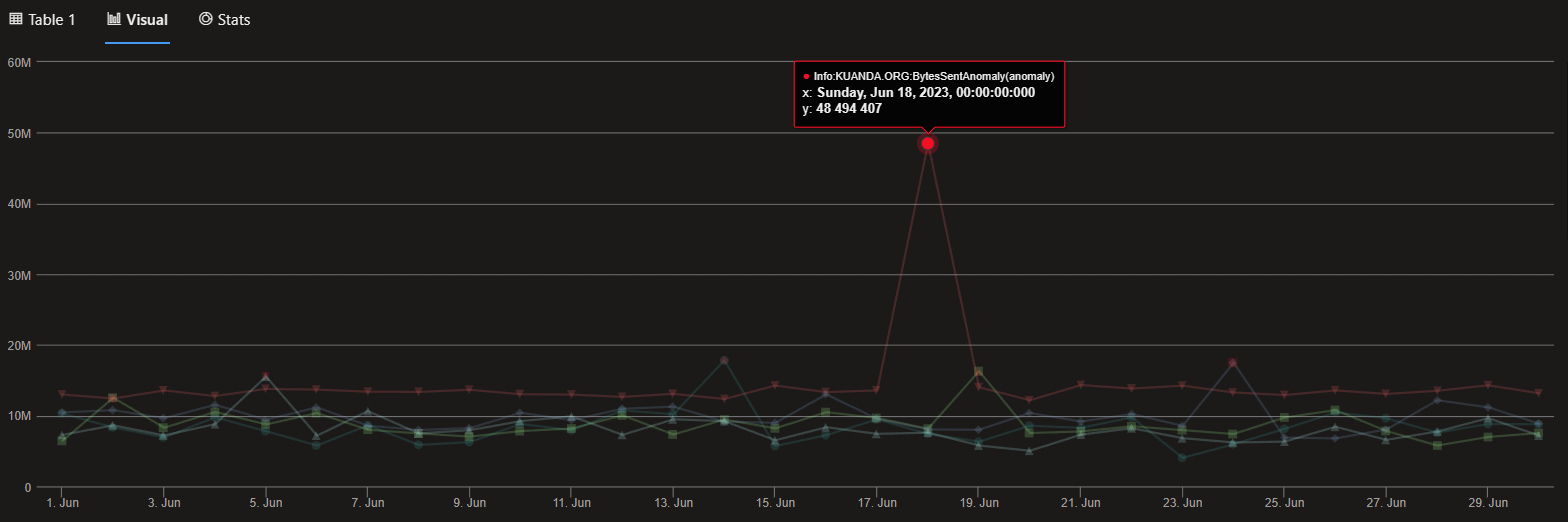
Just for completeness, if we wanted to check the graphical result, here’s the query:
let window = 1d;
NetworkMetrics
| lookup IpInfoEx on ClientIP
| make-series BytesSent=sum(BytesSent) on Timestamp step window by Info
| extend  (BytesSentAnomaly, BytesSentAnomalyScore, BytesSentExpected) = series_decompose_anomalies(BytesSent)
| mv-expand
    Timestamp to typeof(datetime),
    BytesSent to typeof(long),
    BytesSentAnomalyScore to typeof(double),
    BytesSentExpected to typeof(long)
| top 1 by BytesSentAnomalyScore
| project Info, Timestamp, BytesSent, BytesSentExpected, BytesSentAnomalyScore
![]()