The Case
Week three, and we’re looking for some hot motors. Captain Samuel Impson has called us in (no sign of the Mayor this week) to help munge through the city records of citizens movements. Digitown is turning out to be quite the crime hotspot, even with such extensive and slightly questionable surveillance.
The Data
We’ve been given a list of stolen cars, and a ton of traffic logs. Let’s have a quick explore of the data.
CarsTraffic
| summarize count(), count_distinct(VIN)
66786729 records of 100312 cars.
StolenCars
| count
And 20 cars that we’re interested in.
Clever Crims, But Not Clever Enough
Capt Impson has also told us that the crims are clever. They’re swapping the plates before moving the cars to their lock-up ready to fence them late. (Do you fence cars? IDK, it’s been years since I watched The Bill). He’s also told us that they like using public car parks to make the switch. Let’s find some high traffic end-of-journey locations.
CarsTraffic
| summarize arg_max(Timestamp, Ave, Street) by VIN
| summarize Count=count() by Ave, Street
| sort by Count
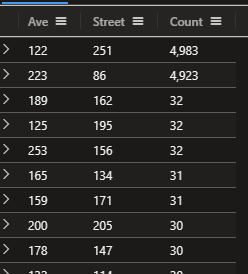
That’s two potential locations for the switch.
Let’s use the same query for the stolen cars.
StolenCars
| join kind=inner CarsTraffic on VIN
| summarize arg_max(Timestamp, Ave, Street) by VIN
| summarize Count=count() by Ave, Street
| sort by Count
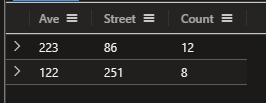
So yes, it looks like the gang are switching the plates at those two car parks.
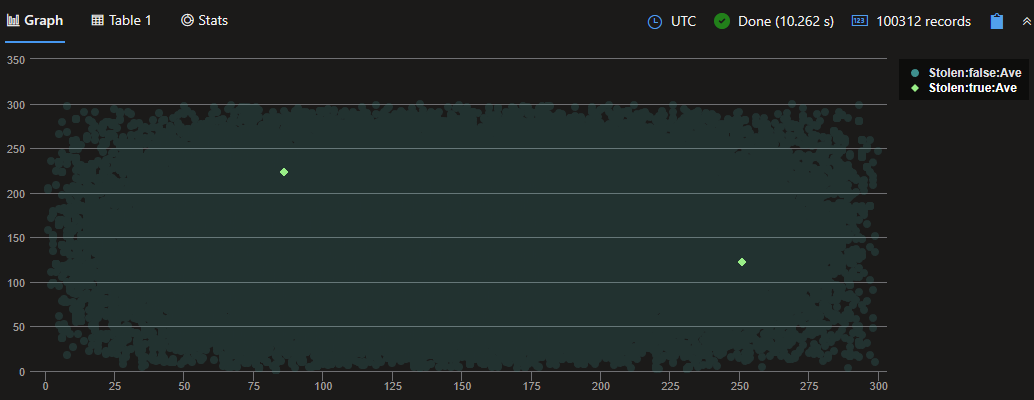
We could also explore the final location clusters of stolen cars graphically:
CarsTraffic
| lookup kind=leftouter (StolenCars | extend Stolen=True)  on VIN
| extend Stolen=coalesce(Stolen, False)
| summarize arg_max(Timestamp, Ave, Street, Stolen) by VIN
| render scatterchart with (xcolumn=Street, ycolumns=Ave, series=Stolen )
But Then Where Did They Go?
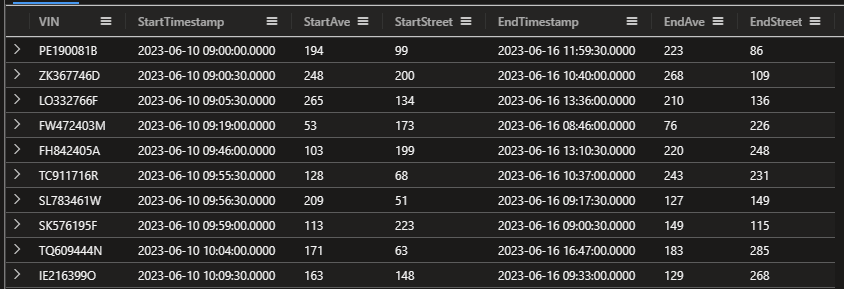
Capt Impson believes the crims are super efficient at plate swapping and the cars leave the parking within a few minutes. Let’s shape our data to show the first and last locations of each car, and the corresponding timestamps. From there we can look for cars leaving the parking lots within a few minutes of the stolen cars arriving.
CarsTraffic
| summarize StartTimestamp=arg_min(Timestamp, Ave,Street), EndTimestamp=arg_max(Timestamp, Ave, Street) by VIN
| project-rename StartAve=Ave, StartStreet=Street, EndAve=Ave1, EndStreet=Street1
| take 100
Now we have all the pieces. First, we’ll take the final recorded location of each stolen car and the arrival time, then we’ll look for all cars leaving that spot within 5 minutes. Finally, we’ll look where 20 of these cars end up.
let StolenCarsTraffic=(
    StolenCars
    | join kind=inner CarsTraffic on VIN
    | summarize arg_max(Timestamp, Ave, Street) by VIN
    | project-rename StolenVIN=VIN
);
CarsTraffic
| summarize StartTimestamp=arg_min(Timestamp, Ave,Street), EndTimestamp=arg_max(Timestamp, Ave, Street) by VIN
| project-rename StartAve=Ave, StartStreet=Street,EndAve=Ave1, EndStreet=Street1
| join kind=inner StolenCarsTraffic on $left.StartAve == $right.Ave and $left.StartStreet == $right.Street
| where StartTimestamp between (Timestamp .. 5m)
| summarize Count=count() by EndAve, EndStreet
| top 1 by Count
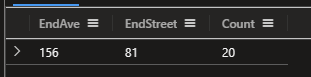
Case solved.
![]()