The Case
The second case is all about fishy elections and a suspicious goldfish.
- Prove the Fish fixed it.
- Work out the correct totals.
Proving
Although I’m not Matt Parker here’s a very bad go at running the results past Benford’s Law:
Votes
| summarize Count=count() by vote, via_ip
| extend num = substring(tostring(Count),0,1)
| summarize Count=count() by num, vote
| sort by num asc
| render columnchart with (series=vote)
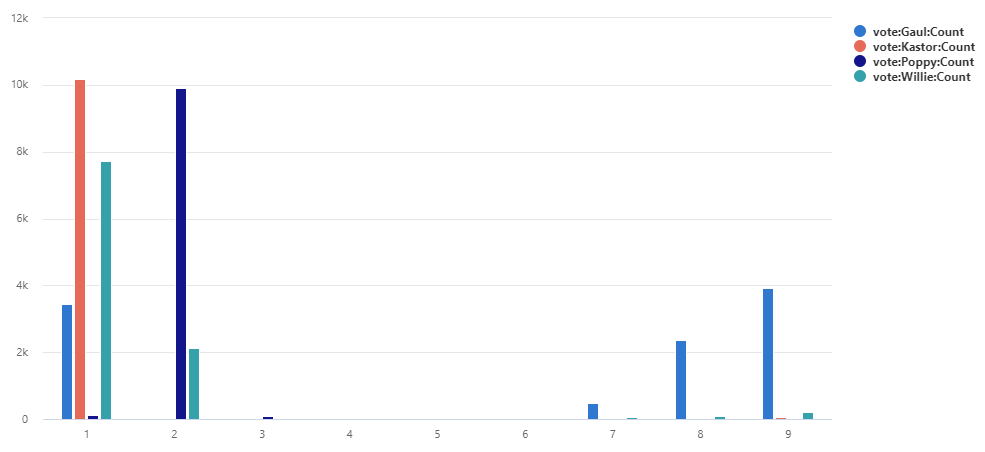
Something very fishy there. And maybe Gaul was up to some vote rigging too?
Solving
We’re given the query that tallies the votes:
// Query that counts the votes:
Votes
| summarize Count=count() by vote
| as hint.materialized=true T
| extend Total = toscalar(T | summarize sum(Count))
| project vote, Percentage = round(Count*100.0 / Total, 1), Count
| order by Count
So let’s run it:
| Vote | Percentage | Count |
|---|---|---|
| Poppy | 51.7 | 2601570 |
| Kastor | 25.6 | 1285782 |
| Gaul | 19.4 | 976570 |
| Willie | 3.3 | 166499 |
Solution
After some digging around (I really should keep better notes), I started playing with time intervals between votes. With a small enough bin, the other candidates were receiving a single vote per time slice, whereas Poppy nearly always exceeded this.
Removing any votes where the count per bin > 1 and summing using the given logic gave the answer:
Votes
| summarize Count = count() by vote, via_ip, bin(Timestamp, 500ms)
| extend Count = iff(Count > 1, 0, Count)
| summarize Count=sum(Count) by vote
| as hint.materialized=true T
| extend Total = toscalar(T | summarize sum(Count))
| project vote, Percentage = round(Count*100.0 / Total, 1), Count
| order by Count
| Vote | Percentage | Count |
|---|---|---|
| Kastor | 50.8 | 1284188 |
| Gaul | 38.6 | 975554 |
| Willie | 6.6 | 166479 |
| Poppy | 4 | 102278 |
There’s probably a better way using fancy ML in Kusto but like I said, I’m not Matt Parker.