
Hello Outlook My Old Friend
Ding, another email from my favourite customer with a Power BI quandry.
“We have a date dimension going back a zillionty years, how can we dynamically create parameters to add to a custom SQL query to restrict out DateDim import to the range in our fact?”
No problemo, let’s bust out some simple Power Query goodness, and no mucking about with query parameters or getting custom native SQL to fold (looking at you Value.NativeQuery and [EnableFolding=true])
Show Me The Code
For this example, I’m using a csv extract of AdventureWorksDW: Sales.csv, approx 6000 sales for Jan 2020, and Date.csv a very simple date dimension covering about 5 years.
The idea: only import a subset of the date dimension that covers the order date range in the Sales fact. And make it fold (did we mention that?)
First, the Sales query:
let
    Source = Csv.Document(File.Contents(DataFolder & "/Sales.csv"),[Delimiter=",", Columns=7, Encoding=1252, QuoteStyle=QuoteStyle.None]),
    #"Promoted Headers" = Table.PromoteHeaders(Source, [PromoteAllScalars=true]),
    #"Changed Type" = Table.TransformColumnTypes(#"Promoted Headers",{{"OrderDateKey", Int64.Type}, {"Order Quantity", Int64.Type}, {"Unit Price", type number}, {"Extended Amount", type number}, {"Product Standard Cost", type number}, {"Total Product Cost", type number}, {"Sales Amount", type number}})
in
    #"Changed Type"
Next, the filtered Date query. StartDate and EndDate retrieve the max and min dates from the Sales query and apply as a filter to our Date query.
let
    Source = Csv.Document(File.Contents(DataFolder & "/Date.csv"),[Delimiter=",", Columns=7, Encoding=1252, QuoteStyle=QuoteStyle.None]),
    #"Promoted Headers" = Table.PromoteHeaders(Source, [PromoteAllScalars=true]),
    #"Changed Type" = Table.TransformColumnTypes(#"Promoted Headers",{{"DateKey", Int64.Type}, {"Date", type datetime}, {"Fiscal Year", type text}, {"Fiscal Quarter", type text}, {"Month", type date}, {"MonthKey", Int64.Type}, {"Full Date", type date}}),
    StartDate = List.Min(Sales[OrderDateKey]),
    EndDate = List.Max(Sales[OrderDateKey]),
    #"Filtered Rows" = Table.SelectRows(#"Changed Type", each [DateKey] >= StartDate and [DateKey] <= EndDate)
in
    #"Filtered Rows"
(DataFolder is a parameter pointing to, well, the data folder.)
Easy peasy. But maybe too easy. For a simple csv example it looks OK, but what about something a bit more real-world? And what about the most important question of all - “But does it fold Bro?”
Yeah, neato, but does it fold?
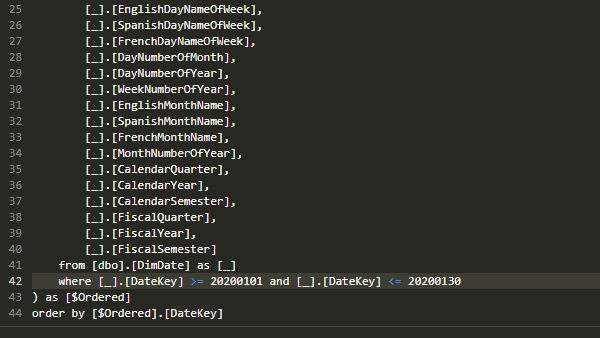
Let’s switch our source over to a copy of AdventureWorksDW on a Azure SQL DB. By right clicking on the #"Filtered Rows" step in the Date query we can check if we’ve stuffed up folding…
Behold! The magic “View Native Query” isn’t greyed out :) So yes, it folds:

And just to make sure, firing up Azure Data Studio to run a trace we can see, yes indeed, it folds Bro.
Another Happy Customer
Example dispatched and another happy customer reports success. I love my job.
Two Days Later: Plot Twist!
Nooo… it didn’t fold! But fixing that is something for another blog post… spoilers